Bitcoin under $10,000 is history, Only going up from here | Bitcoin Chart Goes Extreme Bullish
You may never see a 4 digit BTC price ever. Spotted by prominent crypto exchange Bitstamp, the three-day Bitcoin (BTC) to U.S. Dollar chart on their platform recently printed what is known as a “golden cross”.
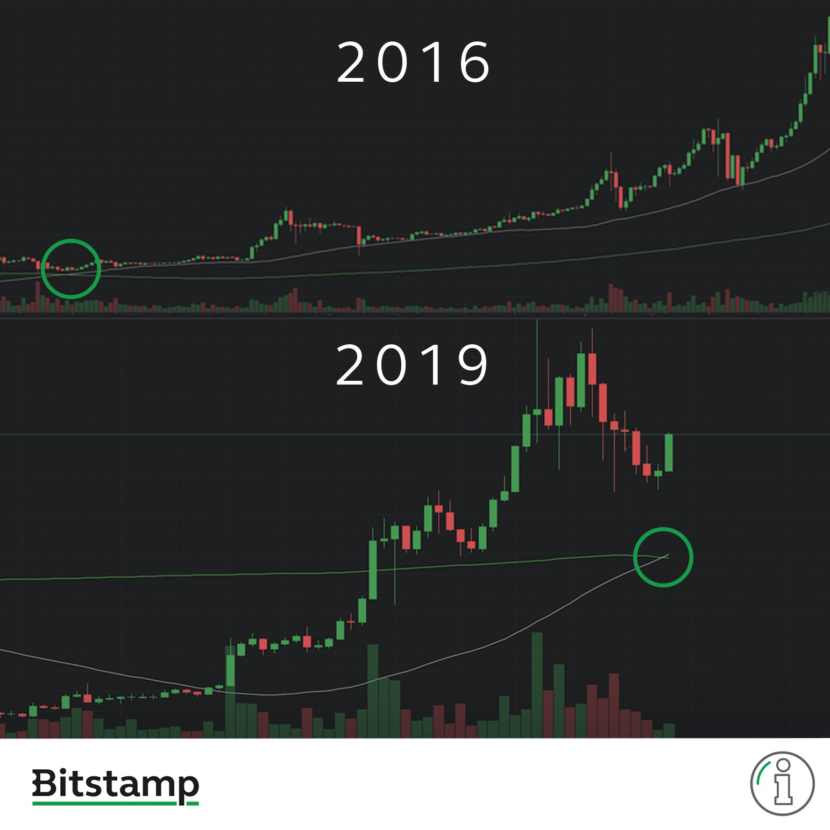
The one that Bitcoin’s three-day chart recently saw was the cross of the 50 moving average above the 200 moving average. What’s notable about this is the last time this technical event played out was early-2016, February 2016, ethereumworldnews reports. This being the rally from $500 to $20,000 — a jaw-dropping 4,000% move — in under 24 months, of course. Should history repeat from here, Bitcoin could reach $400,000 by mid-2021.
BULLISH: The 50MA crossed above the 200MA on the 3-day BTC/USD chart, forming a so-called golden cross. The last time this happened was in February 2016. pic.twitter.com/WplNLcuTmc
— Bitstamp (@Bitstamp) August 2, 2019
another indicator is the U.S. Dollar value of the coins sent in one day passing above the peak of the previous bubble. Just recently, like literally the other week, this occurred, with the value of the Bitcoin sent through the blockchain surmounting some $60 billion.
The current amount sent in USD passing the amount sent in USD during the peak of the last bubble has been an indicator of a new bull market for bitcoin.#HODL $BTC pic.twitter.com/usXA8vSvM7
— AwyeeBitcoin ? (@DeaterBob) July 24, 2019
Categories: cryptocurrency, Gaming News, Technology
CONTACTS DETAILS &FOR MORE INFO:
https://www.ultragamerz.com/contact/
- Solana Soars: Could a $450+ SOL Ignite a Meme Coin Frenzy? - June 26, 2024
- Rainbow Six Siege – Official Marketplace Trailer - June 25, 2024
- ImagenAI Poised for Takeoff: Can This Ethereum-Based AI Coin Go 20x? - June 25, 2024